


Raspberry Pi Status Logger With Python

Made by CETECH11
About the project
We will guide you in implementing a Python script to monitor the status of the Raspberry Pi.
Project info
Difficulty: Easy
Estimated time: 1 hour
License: GNU General Public License, version 3 or later (GPL3+)
Story
Are you a Raspberry Pi enthusiast looking to monitor and log the status of your Raspberry Pi in real time? This project provides a comprehensive guide to creating a Python script that logs and displays system status data, including CPU temperature, CPU load, memory usage, and network status. By leveraging the power of Python and the "curses" library, we create a text-based UI to visualize the data and log it to a file for future analysis.
- Real-Time Monitoring: Continuously monitor CPU temperature, CPU load, memory usage, and network status.
- Text-Based UI: Use the
curseslibrary to create a user-friendly, text-based interface. - Data Logging: Save all the monitored data to a log file with timestamps for later analysis.
- Cross-Platform Compatibility: Easily run the script on various Raspberry Pi models.
- Raspberry Pi: Any model that supports GPIO pins and Python (e.g., Raspberry Pi 3 or 4).
- Python: A versatile and powerful programming language.
- Curses Library: A Python library for creating text-based UIs.
- PSUtil Library: A Python library for retrieving system information.

You must check out PCBWAY for ordering PCBs online for cheap!
You get 10 good-quality PCBs manufactured and shipped to your doorstep for cheap. You will also get a discount on shipping on your first order. Upload your Gerber files onto PCBWAY to get them manufactured with good quality and quick turnaround time. PCBWay now could provide a complete product solution, from design to enclosure production. Check out their online Gerber viewer function. With reward points, you can get free stuff from their gift shop. Also, check out this useful blog on PCBWay Plugin for KiCad from here. Using this plugin, you can directly order PCBs in just one click after completing your design in KiCad.
Script Details and ExplanationThe Python script performs the following tasks:
Retrieve CPU Temperature:
def get_cpu_temp():
    temp = os.popen("vcgencmd measure_temp").readline()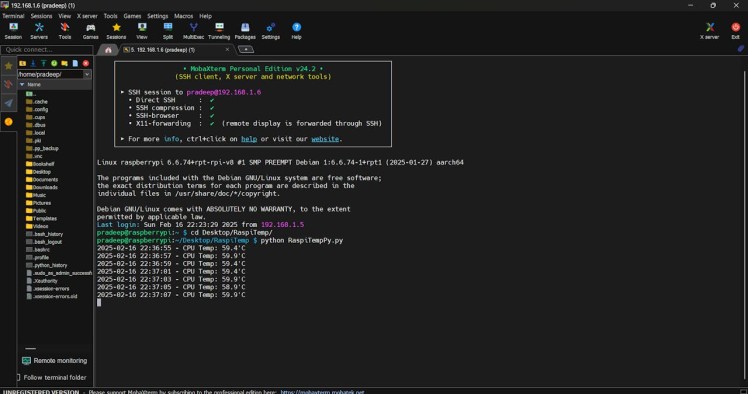
return temp.replace("temp=", "").strip()Explanation: This function uses the vcgencmd command to retrieve the CPU temperature. The result is processed and stripped of unwanted characters.
This simple command can read the temperature data.
Fetch CPU Load:
def get_cpu_load():
return psutil.cpu_percent(interval=1)Explanation: This function uses the psutil library to get the CPU load percentage. The interval parameter ensures the value is averaged over one second.
Get Memory Usage:
def get_memory_usage():
    mem = psutil.virtual_memory()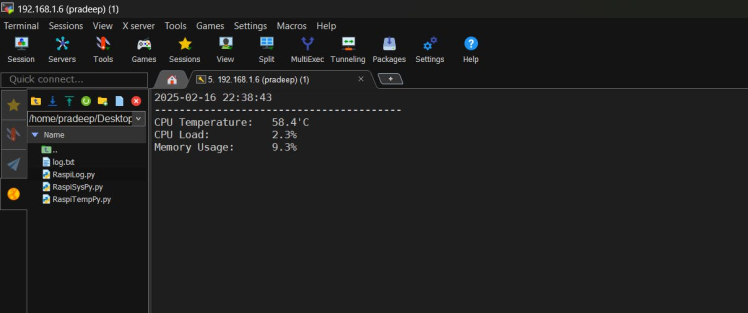
return mem.percentExplanation: This function retrieves memory usage information using the psutil library and returns the percentage of memory used.
By using the above two functions we can read back CPU load and memory usage:
Obtain Network Status:
def get_network_status():
    net_io = psutil.net_io_counters(pernic=True)
    status = {}
    for iface, io in net_io.items():
        status[iface] = {
            "bytes_sent": io.bytes_sent,
            "bytes_recv": io.bytes_recv
        }
return statusExplanation: This function gathers network statistics for each network interface, including the total bytes sent and received. It uses the psutil library to fetch this data.
Log Data:
def log_system_status(log_file, cpu_temp, cpu_load, memory_usage, network_status):
    with open(log_file, "a") as log:
        log.write(f"{time.strftime('%Y-%m-%d %H:%M:%S')}n")
        log.write(f"CPU Temperature:   {cpu_temp}n")
        log.write(f"CPU Load:          {cpu_load}%n")
        log.write(f"Memory Usage:      {memory_usage}%n")
        log.write("Network Status:n")
        for iface, stats in network_status.items():
            log.write(f"  {iface}:n")
            log.write(f"    Bytes Sent:    {stats['bytes_sent']}n")
            log.write(f"    Bytes Received: {stats['bytes_recv']}n")
log.write("-" * 40 + "n")Explanation: This function logs the system status to a specified file. It writes the timestamp, CPU temperature, CPU load, memory usage, and network statistics.
Display Data:
def display_system_status(stdscr, log_file):
    curses.curs_set(0)
    stdscr.nodelay(1)
    stdscr.timeout(1000)

    while True:
        stdscr.clear()
        cpu_temp = get_cpu_temp()
        cpu_load = get_cpu_load()
        memory_usage = get_memory_usage()
        network_status = get_network_status()

        stdscr.addstr(0, 0, f"{time.strftime('%Y-%m-%d %H:%M:%S')}")
        stdscr.addstr(1, 0, "-" * 40)
        stdscr.addstr(2, 0, f"CPU Temperature:   {cpu_temp}")
        stdscr.addstr(3, 0, f"CPU Load:          {cpu_load}%")
        stdscr.addstr(4, 0, f"Memory Usage:      {memory_usage}%")
        stdscr.addstr(5, 0, "nNetwork Status:")

        row = 7
        for iface, stats in network_status.items():
            stdscr.addstr(row, 0, f"  {iface}:")
            stdscr.addstr(row + 1, 2, f"Bytes Sent:    {stats['bytes_sent']}")
            stdscr.addstr(row + 2, 2, f"Bytes Received: {stats['bytes_recv']}")
            row += 4

        stdscr.refresh()

        log_system_status(log_file, cpu_temp, cpu_load, memory_usage, network_status)

        key = stdscr.getch()
        if key == ord('q'):
breakExplanation: This function uses the curses library to create a text-based UI that updates the system status in real time. It also logs the data to a specified file and exits the program when 'q' is pressed.
Main Function:
if __name__ == "__main__":
    log_file = "/home/pi/system_status_log.txt"  # Specify the log file path
curses.wrapper(display_system_status, log_file)Explanation: The main function specifies the log file path and invokes the curses.wrapper() method to start the display loop.
import os
import time
import psutil
import curses

def get_cpu_temp():
    temp = os.popen("vcgencmd measure_temp").readline()
    return temp.replace("temp=", "").strip()

def get_cpu_load():
    return psutil.cpu_percent(interval=1)

def get_memory_usage():
    mem = psutil.virtual_memory()
    return mem.percent

def get_network_status():
    net_io = psutil.net_io_counters(pernic=True)
    status = {}
    for iface, io in net_io.items():
        status[iface] = {
            "bytes_sent": io.bytes_sent,
            "bytes_recv": io.bytes_recv
        }
    return status

def log_system_status(log_file, cpu_temp, cpu_load, memory_usage, network_status):
    with open(log_file, "a") as log:
        log.write(f"{time.strftime('%Y-%m-%d %H:%M:%S')}n")
        log.write(f"CPU Temperature:   {cpu_temp}n")
        log.write(f"CPU Load:          {cpu_load}%n")
        log.write(f"Memory Usage:      {memory_usage}%n")
        log.write("Network Status:n")
        for iface, stats in network_status.items():
            log.write(f"  {iface}:n")
            log.write(f"    Bytes Sent:    {stats['bytes_sent']}n")
            log.write(f"    Bytes Received: {stats['bytes_recv']}n")
        log.write("-" * 40 + "n")

def display_system_status(stdscr, log_file):
    curses.curs_set(0)
    stdscr.nodelay(1)
    stdscr.timeout(1000)

    while True:
        stdscr.clear()
        cpu_temp = get_cpu_temp()
        cpu_load = get_cpu_load()
        memory_usage = get_memory_usage()
        network_status = get_network_status()

        stdscr.addstr(0, 0, f"{time.strftime('%Y-%m-%d %H:%M:%S')}")
        stdscr.addstr(1, 0, "-" * 40)
        stdscr.addstr(2, 0, f"CPU Temperature:   {cpu_temp}")
        stdscr.addstr(3, 0, f"CPU Load:          {cpu_load}%")
        stdscr.addstr(4, 0, f"Memory Usage:      {memory_usage}%")
        stdscr.addstr(5, 0, "nNetwork Status:")

        row = 7
        for iface, stats in network_status.items():
            stdscr.addstr(row, 0, f"  {iface}:")
            stdscr.addstr(row + 1, 2, f"Bytes Sent:    {stats['bytes_sent']}")
            stdscr.addstr(row + 2, 2, f"Bytes Received: {stats['bytes_recv']}")
            row += 4

        stdscr.refresh()

        log_system_status(log_file, cpu_temp, cpu_load, memory_usage, network_status)

        key = stdscr.getch()
        if key == ord('q'):
            break

if __name__ == "__main__":
    log_file = "log.txt"  # Specify the log file path
    curses.wrapper(display_system_status, log_file)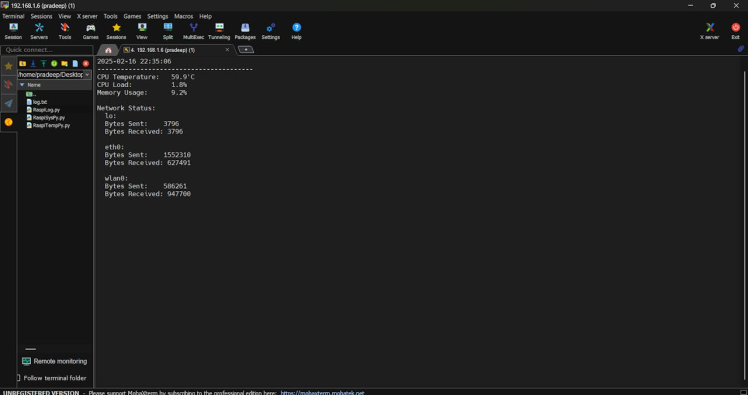
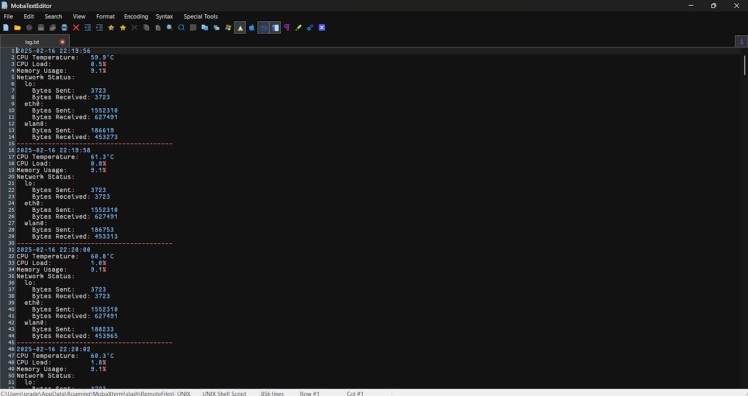
This script will auto-write all the logs into a text file:
- Home Automation: Monitor the health of your Raspberry Pi used in home automation projects to ensure it is running efficiently and not overheating.
- IoT Device Monitoring: Keep track of the system status of Raspberry Pi devices used in various IoT applications to ensure optimal performance.
- Educational Purposes: Teach students about system monitoring, logging, and real-time data visualization using Raspberry Pi and Python..
- Server Health Check: Utilize this script to monitor a Raspberry Pi-based server to ensure it is operating within safe temperatures and performance parameters.
The Raspberry Pi Status Logger with Python is an exciting and practical project that combines system monitoring, data logging, and real-time visualization. Whether you're a hobbyist, educator, or professional, this project provides valuable insights into the performance of your Raspberry Pi and helps you maintain its health and efficiency.
If you have any questions or need further assistance, feel free to reach out! Enjoy your project!
Credits
Related products


g