Peg Box With Temperature And Humidity Monitor
About the project
In this setup, I am going to send the Temperature and Humidity readings to my Raspberry Pi based home server and store it in a MySQL database
Project info
Difficulty: Easy
Platforms: Adafruit, Arduino, Autodesk, Raspberry Pi
Estimated time: 1 hour
License: GNU General Public License, version 3 or later (GPL3+)
Items used in this project
Story
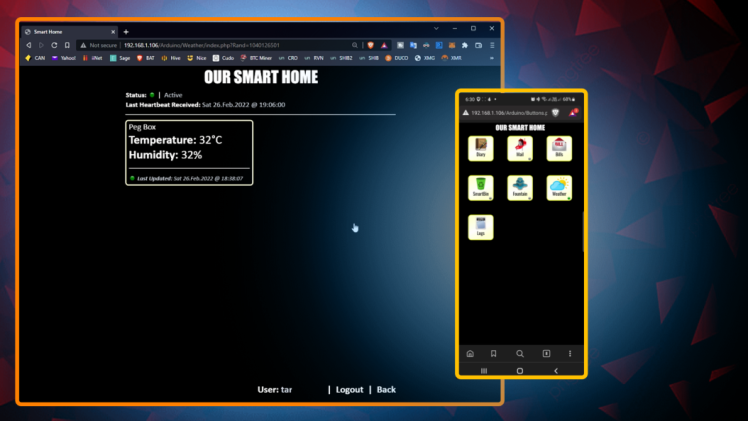
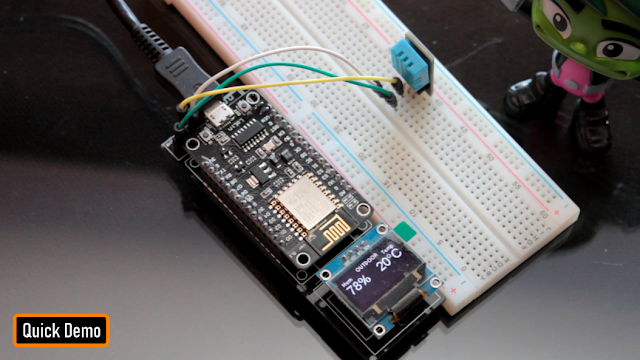
In my last tutorial I created a Weather Station using Arduino and NodeMCU using DHT11 or DHT22 temperature and humidity sensor and displayed it using an OLED Display. In this tutorial, I am going create a Peg-Box using the same board but with a little bit of twist. In this setup, I am going to send the Temperature and Humidity readings to my Raspberry Pi based home server and store it in a MySQL database. The data can then be viewed using PHP and Google Charts, on a Mobile Phone or a PC connected to the home network.
Circuit Diagram
The Board
Component Assembly
The Code
Then there are two functions SendIamAlive() and SendTemperatureAndHumidity() which sends heartbeat and the data read from the temperature sensor to the database server.
The ReadDHTSensor() function reads the data from the DHT11 or DHT22 sensor.
In the setup section we first setup the WiFi and then send a SendIamAlive() message to the server advising that it is back up and running. Then in the loop section the microcontroller send a heartbeat every minute using the SendIamAlive() function and if the time elapses it sends the humidity and temperature data using the SendTemperatureAndHumidity() function.
The White LED flashes every seconds and the Blue LED turns on when the device sends the temperature and humidity data to the database server.
MySQL
So,the data sent by the NodeMCU over WiFi is saved in the MySQL database hosted on a RaspberryPi 4.Here you can see, the microcontroller sends the data every 30 minutes (you can change the frequency) which is then saved in the MySQL database. The data saved on the Pi's MySQL database can then be used to generate various different types of graphs either by using google charts or any other 3rd party application. It totally depends on you how you want to present it.
3D Design
Woodworking
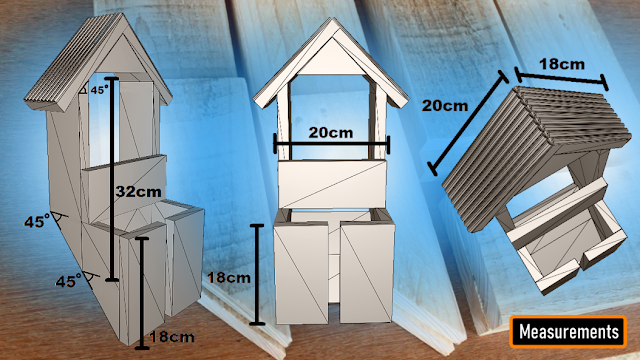
As mentioned earlier, my pallet plank are 9cm wide and hence, all the onscreen measurements are based on that.
Final Assembly
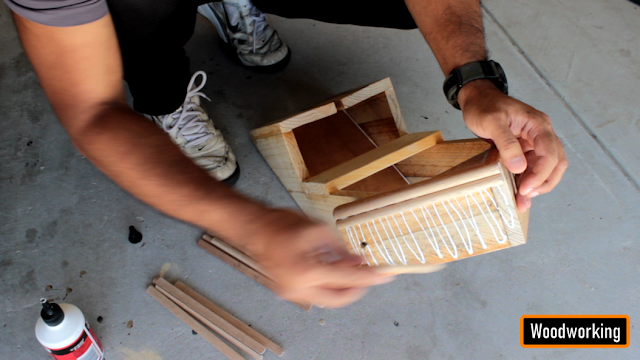
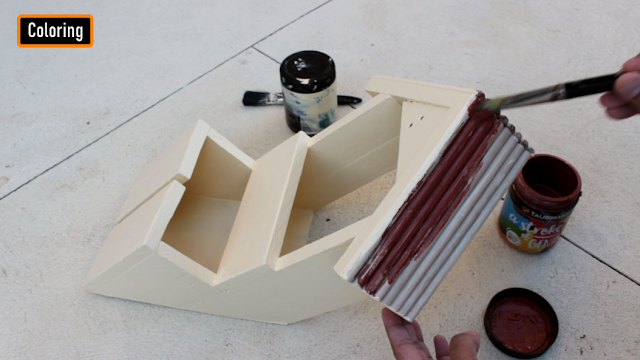
Using wood-glue I am joining all pallet planks used in making the box.I got a bit too excited and accidentally deleted one of my recordings. So, I am using 3D animation to show you guys how I joined the two sides of the box. I used a plywood board to created the base of the bin. I glued few cylindrical wooden sticks on the roof of the box. To be very frank these sticks changed the entire outlook of the peg-box.
Coloring
Installation
Demo
Thanks
Thanks again for checking my post. I hope it helps you.If you want to support me subscribe to my YouTube Channel: https://www.youtube.com/user/tarantula3
Blog Posts:
1. Peg Box
Video references:
1. Peg Box
Resources:
Code:
Code (Arduino + PHP + MySQL DB)
Libraries:
Support My Work:
BTC: 1M1PdxVxSTPLoMK91XnvEPksVuAa4J4dDp
LTC: MQFkVkWimYngMwp5SMuSbMP4ADStjysstm
DOGE: DDe7Fws24zf7acZevoT8uERnmisiHwR5st
ETH: 0x939aa4e13ecb4b46663c8017986abc0d204cde60
BAT: 0x939aa4e13ecb4b46663c8017986abc0d204cde60
LBC: bZ8ANEJFsd2MNFfpoxBhtFNPboh7PmD7M2
Thanks, ca again in my next tutorial.


