Blood Pressure Sensor Interfacing With Raspberry Pi
About the project
Blood pressure measuring and Detailed Report Emailing system using Raspberry Pi.
Project info
Difficulty: Moderate
Platforms: Raspberry Pi
Estimated time: 6 hours
License: GNU General Public License, version 3 or later (GPL3+)
Items used in this project
Hardware components
View all
Software apps and online services
Story
A blood pressure monitoring system provides a useful tool for users to measure and manage their daily blood pressure values. This system can measure the blood pressure and heart rate and then store and forward the measuring information to the management through email. The email will contain the details of the blood pressure in a text file. the text file contains the details of the systolic, diastolic, and heart rate details.
In this project, I have created the classification of blood pressure and Emailing system using raspberry pi and BP Sensor
Blood Pressure BasicsBlood pressure is the pressure of the blood in the arteries as it is pumped around the body by the heart. When your heart beats, it contracts and pushes blood through the arteries to the rest of your body. This force creates pressure on the arteries. Blood pressure is recorded as two numbers— the systolic pressure (as the heart beats) over the diastolic pressure (as the heart relaxes between beats). The unit which measures this is called a Sphygmomanometer.
Monitoring blood pressure at home is important for many people, especially if you have high blood pressure. Blood pressure does not stay the same all the time. It changes to meet your body’s needs. It is affected by various factors including body position, breathing or emotional state, exercise, and sleep. It is best to measure blood pressure when you are relaxed and sitting or lying down.
Classification of blood pressure for adults (18 years and older)
classification of Blood pressure
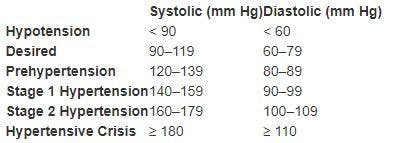
classification of Blood pressure
Block Diagram of the System
Block Diagram
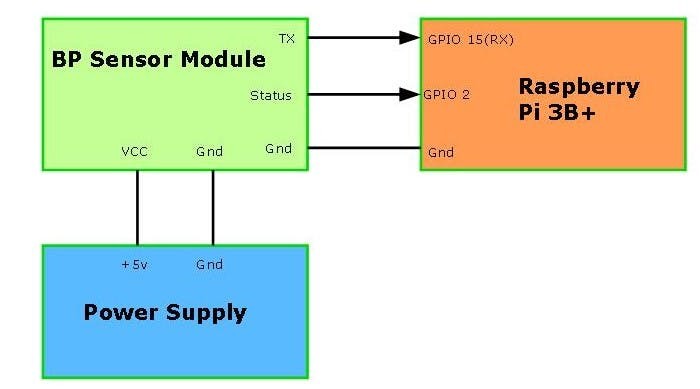
Block Diagram
Blood pressure monitoring and detailed Emailing System Image
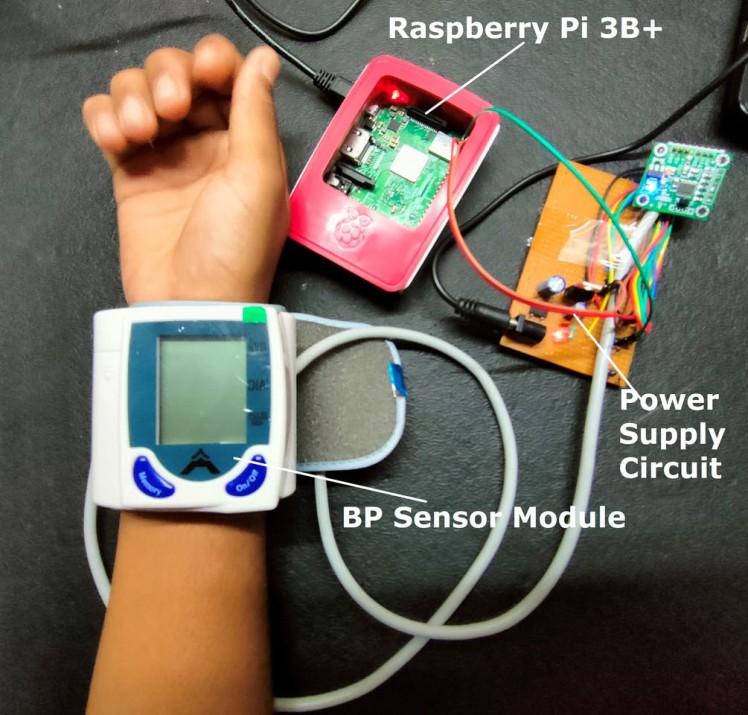
Blood pressure monitoring and detailed Emailing System Image
All The BP Sensors available in the market are not suitable to interface with the external microcontroller. Here I have used Sunrom Bp sensor interface with the raspberry pi.
BP Sensor
Wrist Bp sensor
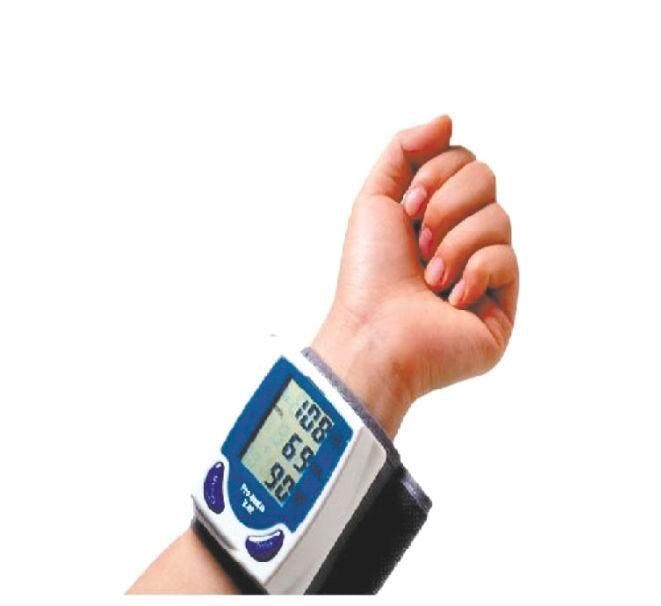
Wrist Bp sensor
Here I have used a wrist wearable Blood pressure sensor. The sensor gives the data Output Through UART Communication.
Features
- Intelligent automatic compression and decompression
- Easy to operate, switching button to start measuring
- 60 store groups memory measurements
- Can read single or all measures
- 3 minutes the automatic power-saving device
- Intelligent device debugging, automatic power to detect
- Local tests for wrist circumference as 135-195mm
- Large-scale digital liquid crystal display screen, Easy to Read Display
- Fully Automatic, Clinical Accuracy, High-accuracy
- Power by External +5V DC
- Serial output data for external circuit processing or display.
Specification
- Working Voltage: +5V, 200mA regulated
- Output Format:Serial Data at 9600 baud rate(8 bits data, No parity, 1 stop bits). Outputs three parameters in ASCII.
The sensing unit wire length is 2 meters
Sensor Pinouts
- TX-OUT = Transmit output. Output serial data of 3V logic level, Usually connected to RXD pin of microcontrollers/RS232/USB-UART.
- +5V = Regulated 5V supply input.
- GND = Board Common Ground
- Status = Indicates the BP sensor is active or Not.
Correct way of using The BP sensor
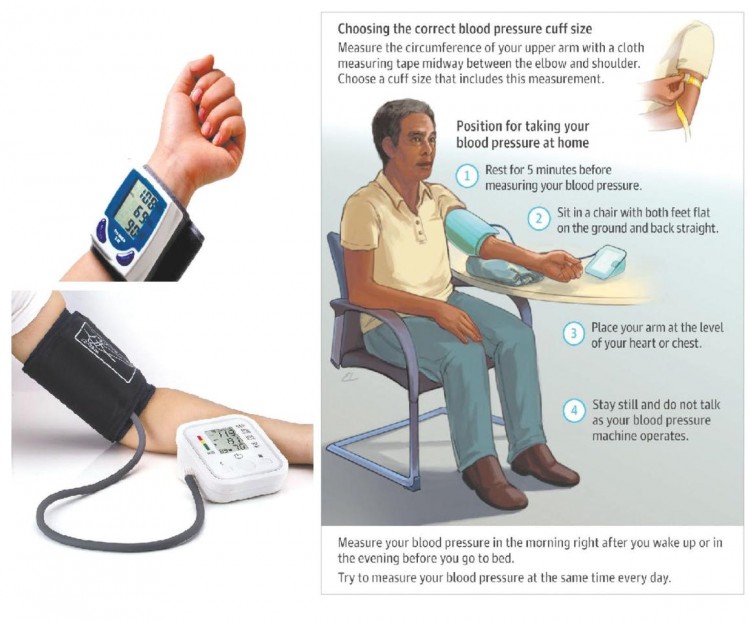
Correct way of using The BP sensor
How the System Works.Raspberry pi 3 B+ Is used in this project to receive the data from the BP Sensor and to process the data. The BP sensor provides the data through the UART Communication to Raspberry pi. The raspberry pi receives the data from the sensor Through UART channel, The Sensor Baud rate is fixed to 9600 hence we need to set the baud rate settings of the Raspberry pi to 9600.
The output reading is 8-bit value in ASCII format fixed digits, from 000 to 255.
Typical reading will be like below where the three values separated by comma and space.
- Systolic
- Diastolic
- Pulse
Example: 129, 107, 095
We have used Terminal software to view reading, You can use any other software also which allows connecting to COM port and view/process data.
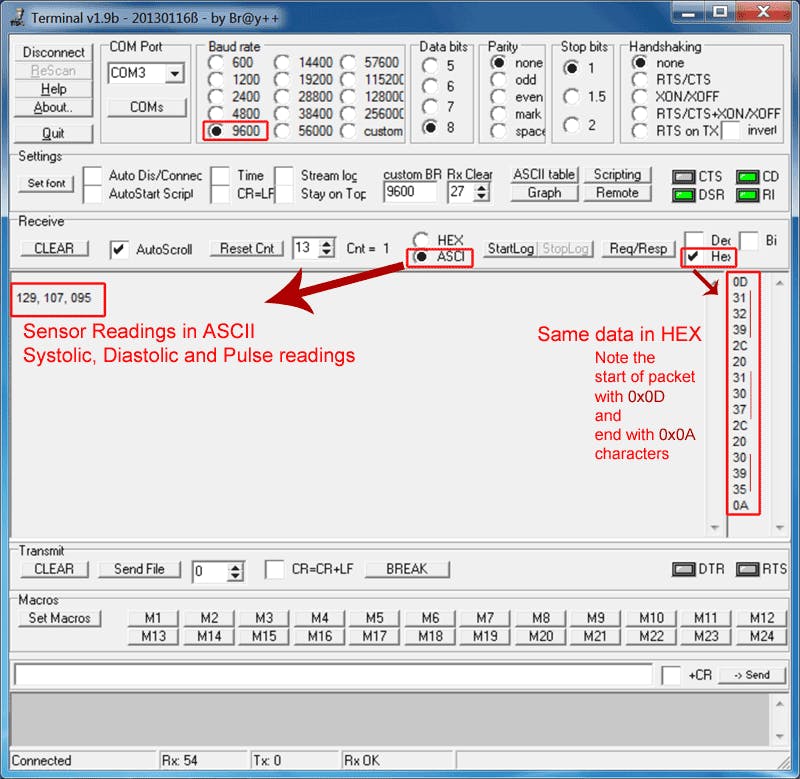
We have used Terminal software to view reading, You can use any other software also which allows connecting to COM port and view/process data.
After Converting the values the data is classified by comparing the systolic and diastolic data according to Standard format.
For Emailing the report I have stored the converted data into a text format. after the classification, the file will be attached to the Email By creating subject details according to the Blood pressure data. For email, I have used SMTP Libraries.
Text File Screenshot

Text File Screenshot
Email Screenshot
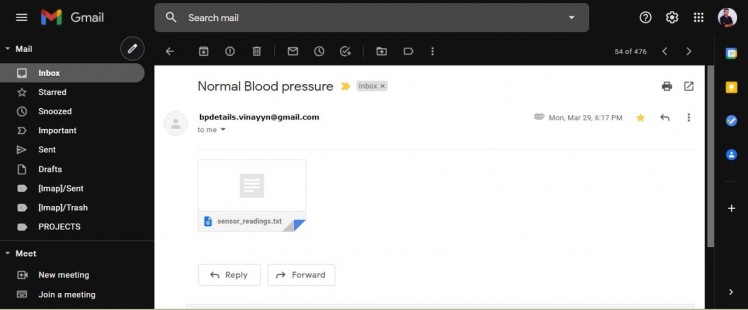
Email Screenshot
Demo Video


